[ECO Bounty] Gas Used History Chart Not Updated on IoTeXScan
Page URL: https://iotexscan.io/charts/gasused
Issue Summary:
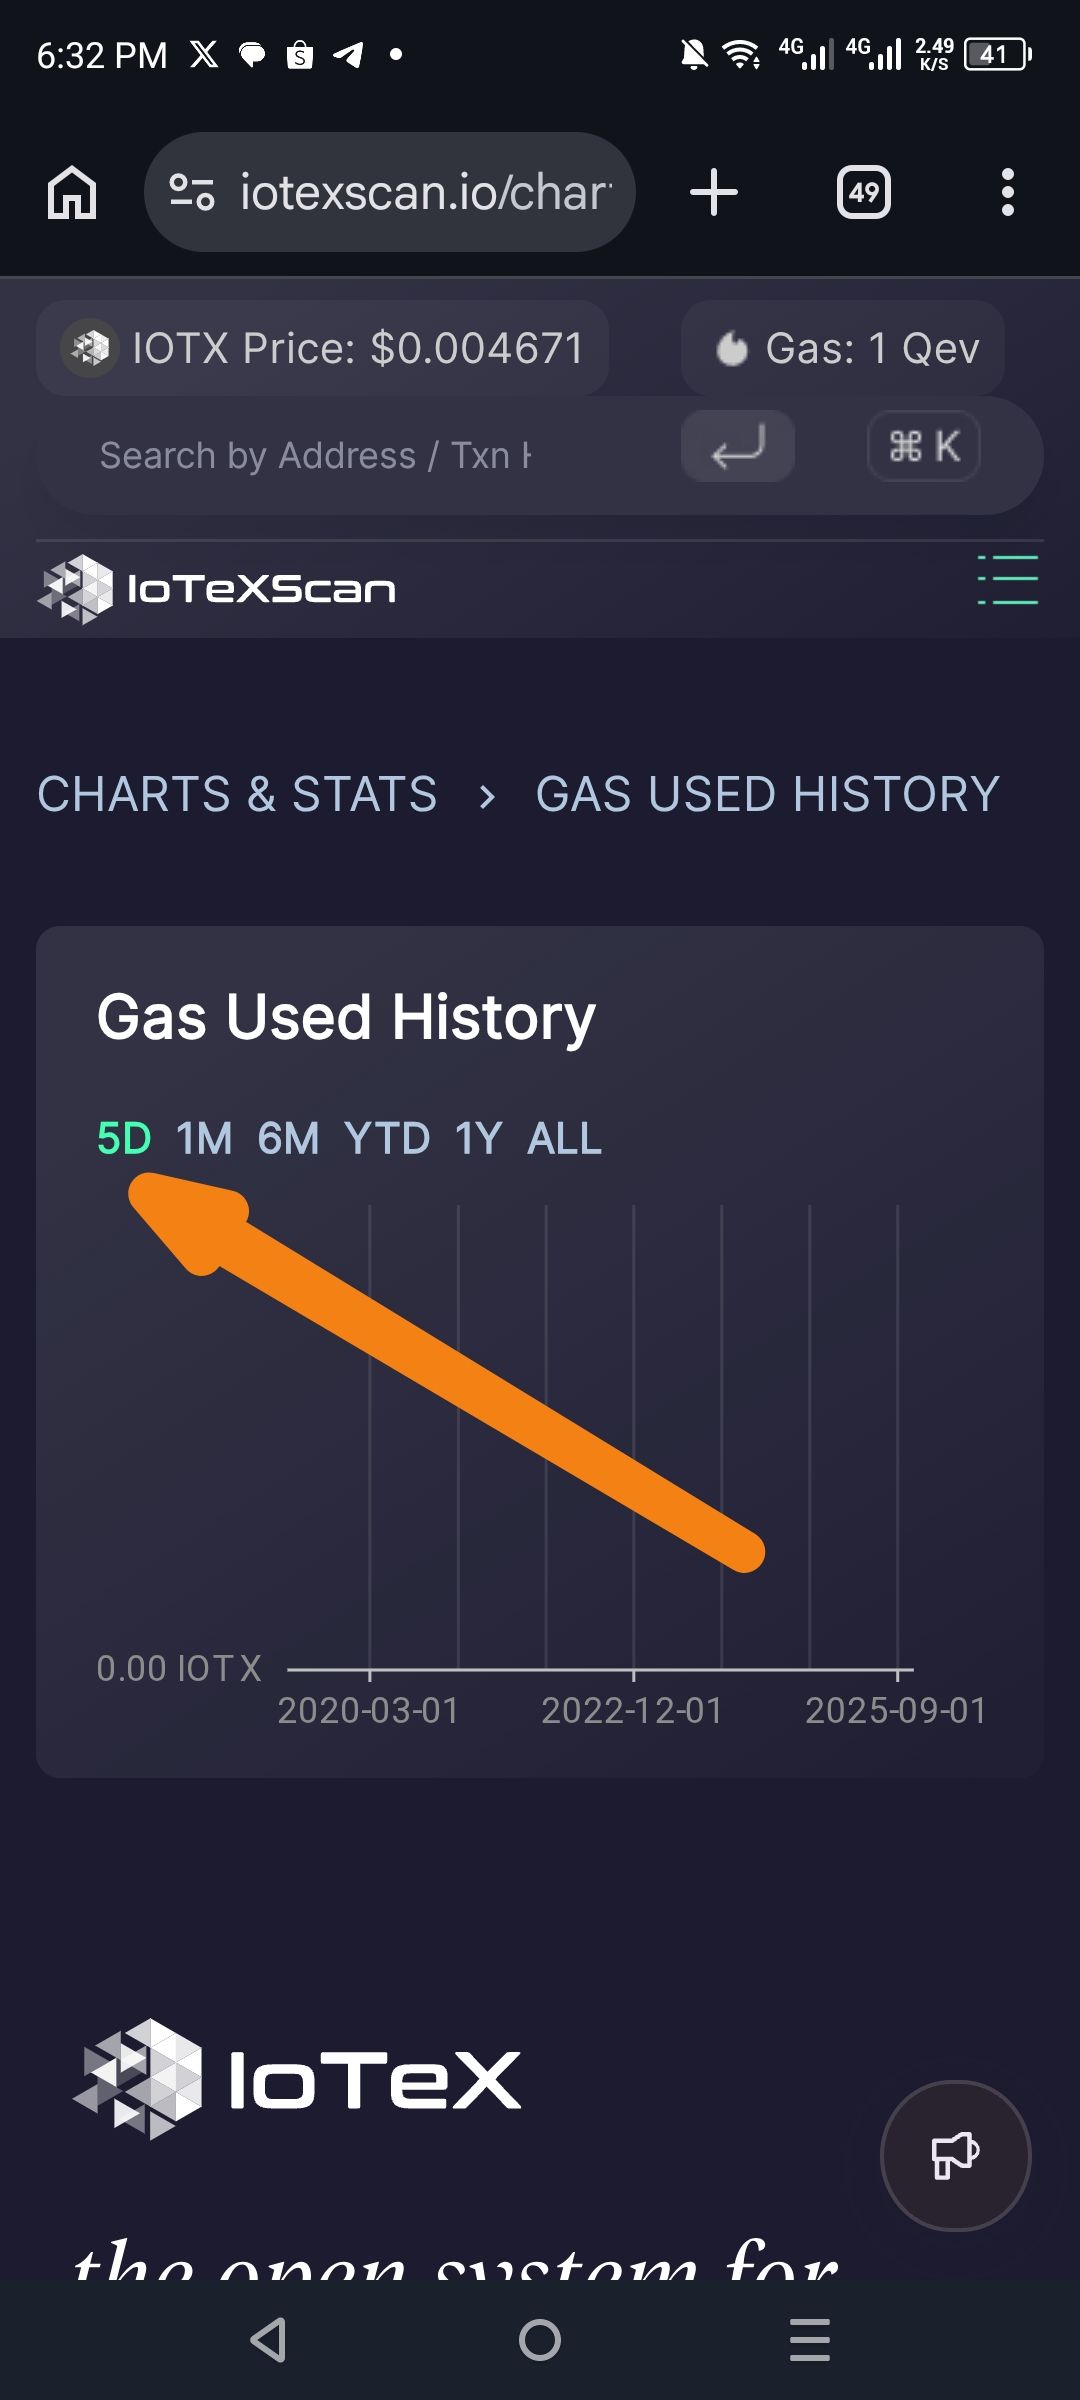
The Gas Used History chart is not displaying recent data. It appears stuck on outdated information (up to ~September 2022), and key metrics like IOTX Price and Gas show as "- No Data". This was verified live— the page fails to load current charts or metrics.
Screenshot Details (from your image):
Mobile view (Android, 6:32 PM).
Chart x-axis ends at "2022-09", with orange arrows highlighting the lack of updates.
Time selectors (5D, 1M, 6M, YTD, 1Y, ALL) are present but don't load fresh data.
Page title: "GAS USED HISTORY" under Charts & Stats.
Steps to Reproduce:
Open https://iotexscan.io/charts/gasused in any browser (mobile/desktop).
Scroll to "Gas Used History" section.
Click time range buttons (e.g., "5D" or "YTD").
Result: No recent data loads (post-2022); metrics show "IOTX Price: - Gas: -". No chart updates.
Expected Behavior:
Chart should show live/recent gas usage history for the IoTeX network.
Metrics (IOTX Price, Gas) should populate with current values.
Time selectors should refresh data dynamically (e.g., up to Feb 2026).
Wallet Address: io1tkw393kejmxwnd454twc6020sxcyvh5dxqmren
Device & Environment:
-Operating system: Android 13
-Device model: Redmi Note 10 Pro
Please authenticate to join the conversation.
In Review
New Issue
5 months ago

cryptotestnet
Subscribe to post
Get notified by email when there are changes.
In Review
New Issue
5 months ago
cryptotestnet
Subscribe to post
Get notified by email when there are changes.