[ECO Bounty] ioTexScan Price Chart Data Stagnation
1. Issue: Price Chart Not Updating (Static Visualization)
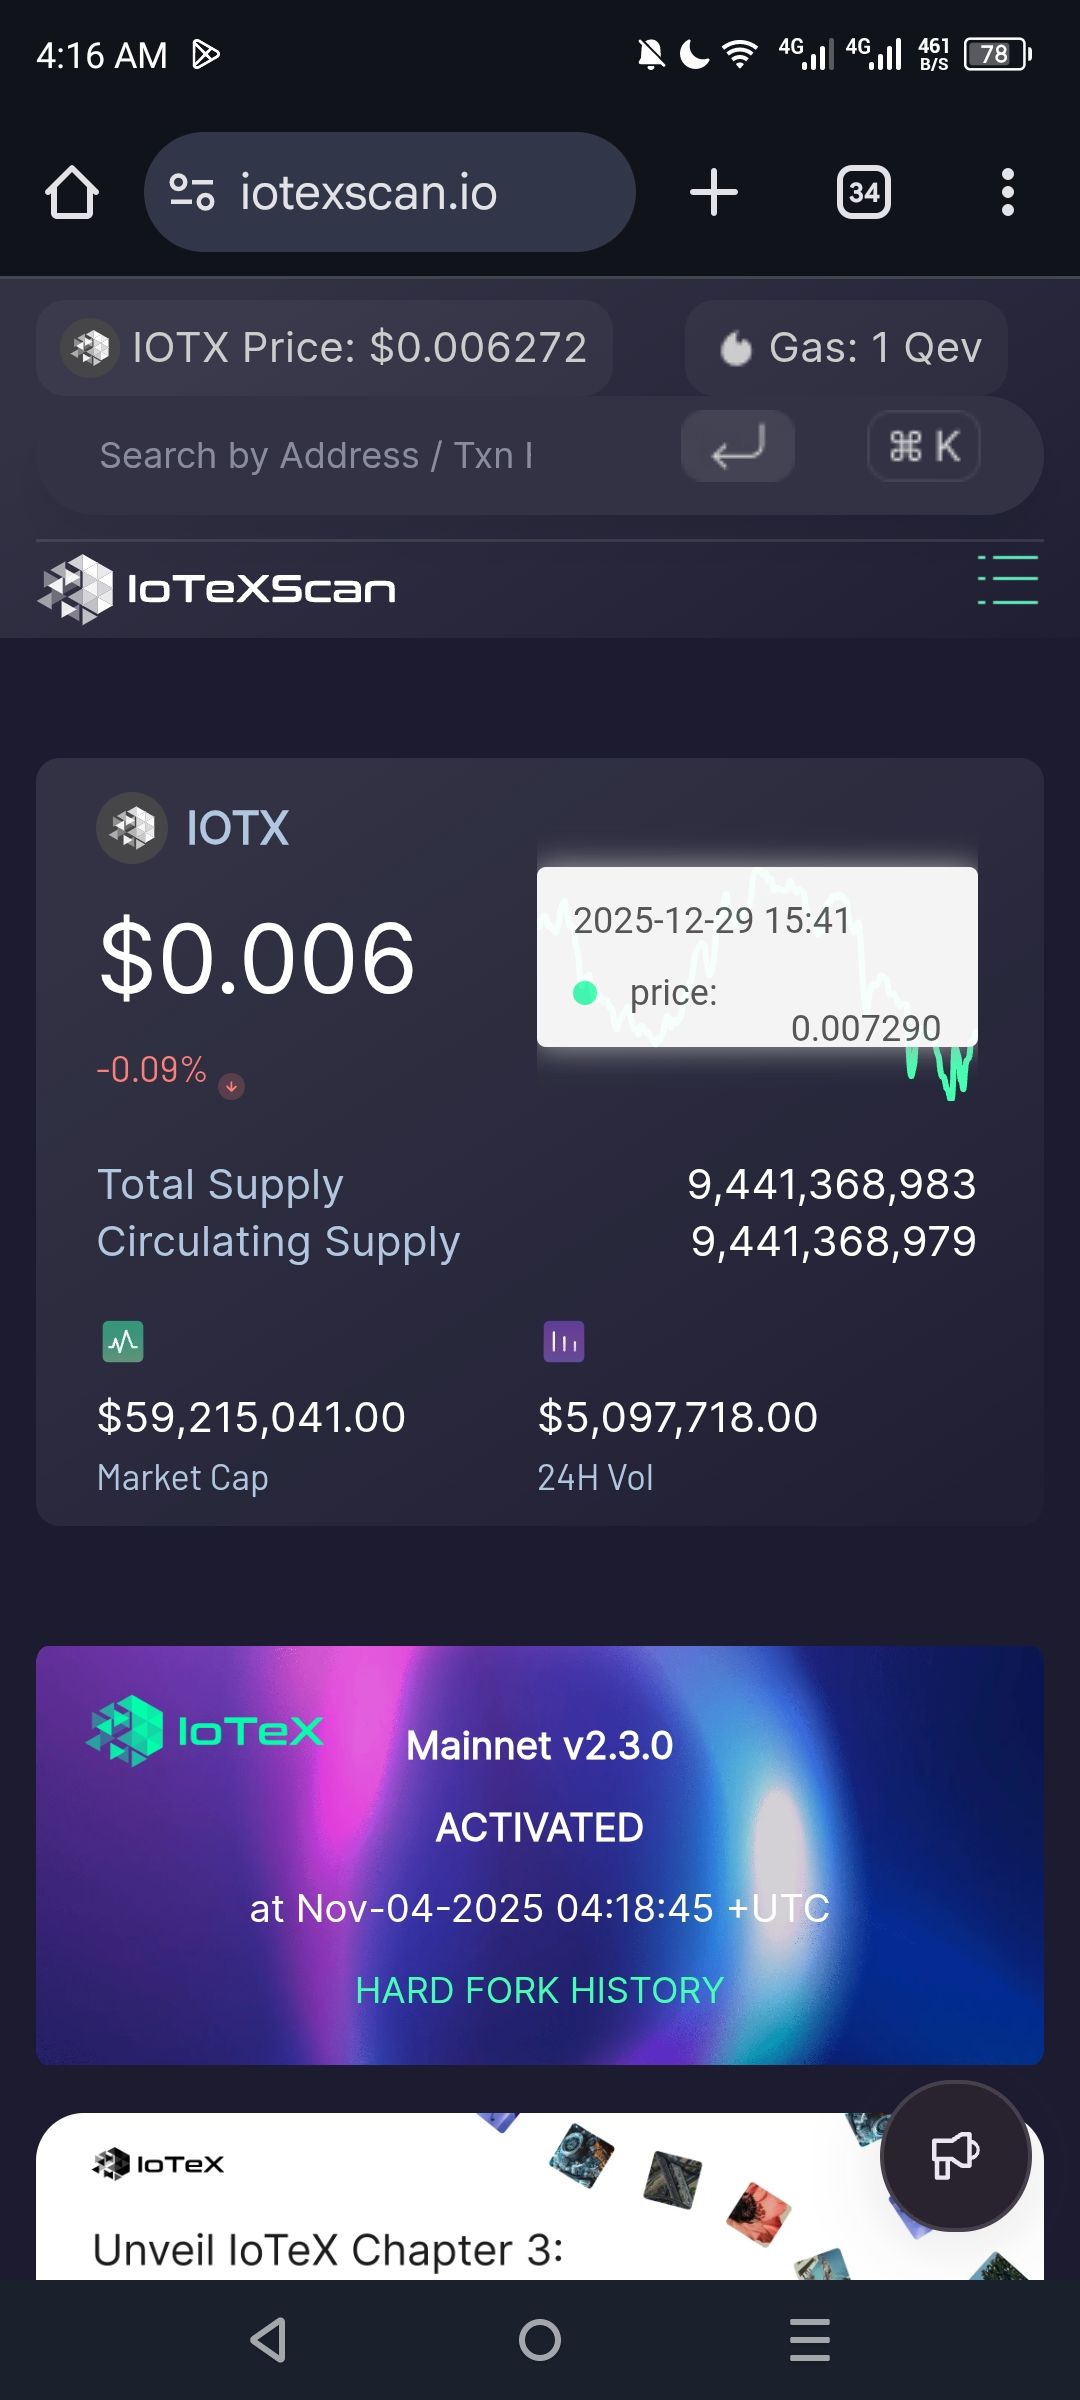
Description: While the "Live Price" text ticker appears to function, the interactive price chart is static. It is failing to plot new candlesticks or line data points in real-time.
Observation: The chart appears "frozen" at a specific historical point, likely corresponding with the major system updates in December 2025. No new data has been rendered on the X-axis (time) for several weeks/months.
Expected Result: The chart should dynamically render new data points (Price vs. Time) as they are received from the WebSocket or API feed.
2. Issue: X-Axis/Time-Scale Discrepancy
Description: The horizontal axis of the chart ends abruptly at a late 2025 timestamp.
Observation: There is a visible gap between the current date (February 2026) and the last data point shown on the chart.
Expected Result: The X-axis should extend to the current system time, showing continuous data through January and February 2026.
Steps to Reproduce
Navigate to iotexscan.io
Locate the main price chart on the dashboard or asset page.
Compare the last data point on the chart's timeline to the current actual time.
Switch between timeframes (1H, 1D, 1W) and observe that no new data is populated for the 2026 period.
Actual Result
The chart displays a "flatline" or simply ends at December 2025, even though the market is active.
UI continues to reference a "Last Update: December 2025," suggesting the chart's data source was never reconnected after the year-end migration.
Wallet Address: io1tkw393kejmxwnd454twc6020sxcyvh5dxqmren
Device & Environment:
-Operating system: Windows 11 Pro
-Device model: A520MHP
Please authenticate to join the conversation.
In Review
New Issue
6 months ago

cryptotestnet
Subscribe to post
Get notified by email when there are changes.
In Review
New Issue
6 months ago
cryptotestnet
Subscribe to post
Get notified by email when there are changes.